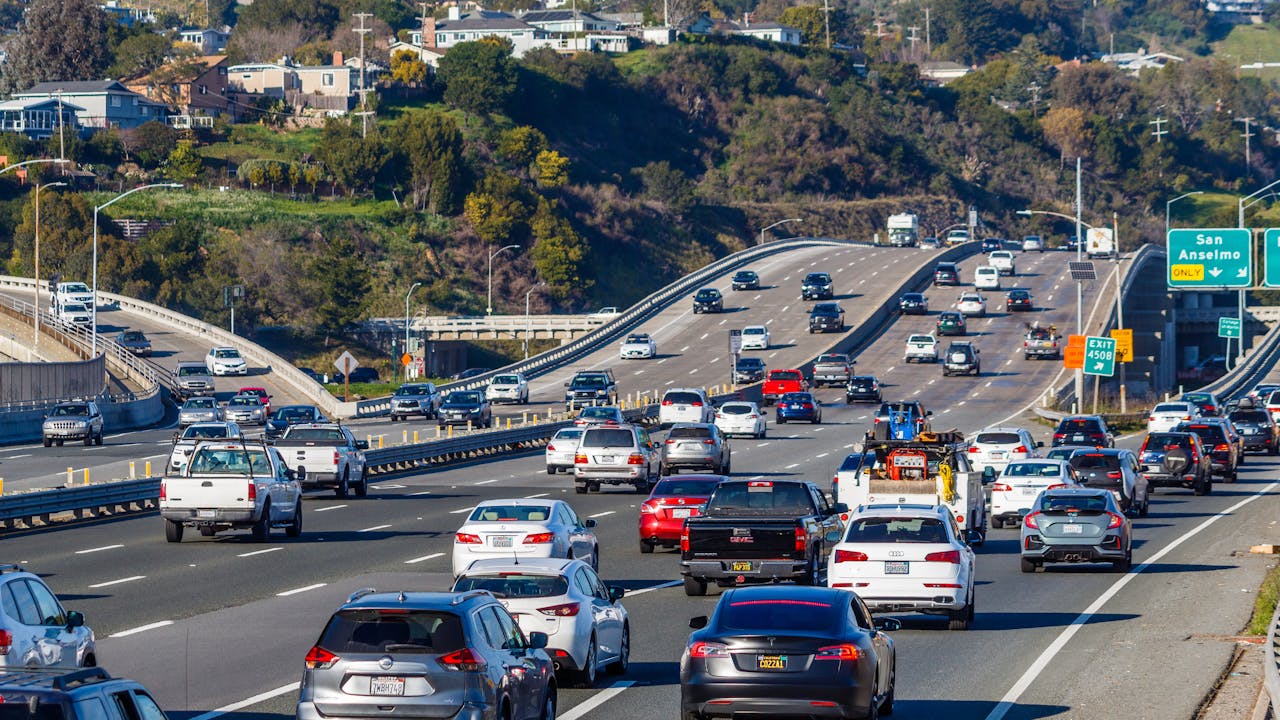
California’s population shift now feels less like a headline and more like a daily condition. The state added residents again in 2024-25, but only slightly, and the gains landed unevenly across counties. That mismatch between statewide growth and local strain is why routines feel unsettled even when totals look stable.
In one place, traffic starts earlier near new subdivisions; in another, familiar blocks feel quieter as households move inland or out of state. Schools, storefronts, and family schedules absorb that movement first. By the time reports are published, many communities have already adjusted around a new rhythm.
One Statewide Number, Many Local Realities
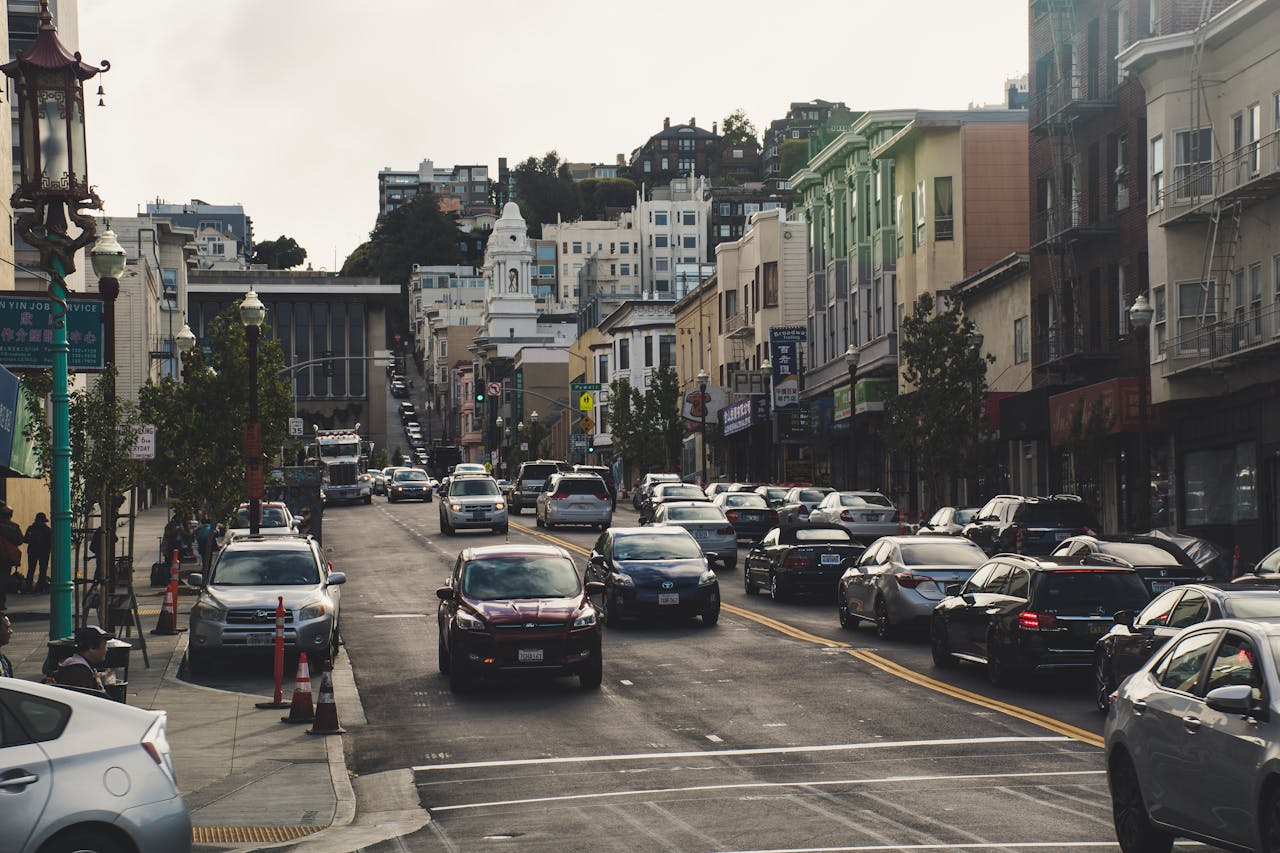
California grew by about 19,200 residents in the year ending July 1, 2025, yet that modest net gain hides strong regional differences. State estimates show continued international inflow and domestic losses, so movement stays active even when the top-line number looks flat. That contrast is why daily life can feel busier and less predictable at the same time.
Residents notice it in practical ways: denser traffic in one corridor, softer demand in another, and neighborhood services that scale up or down faster than expected. The experience is not one statewide mood. It is a patchwork of local pressure and local relief. Daily.
School Patterns Are Shifting in Two Directions

Public school data captures the shift with unusual clarity. California’s 2024-25 TK-12 enrollment fell 0.54 percent to 5,806,221 students, while transitional kindergarten rose 17.2 percent in the same cycle. Fewer students overall, but more in early grades, creates a different planning problem than simple decline.
Districts are revising staffing, routes, and class layouts together. One campus may consolidate upper grades while adding early-learning support, and nearby neighborhoods feel that shift in after-school demand, pickup traffic, and childcare timing. The result is not collapse. It is a live redesign of local education patterns.
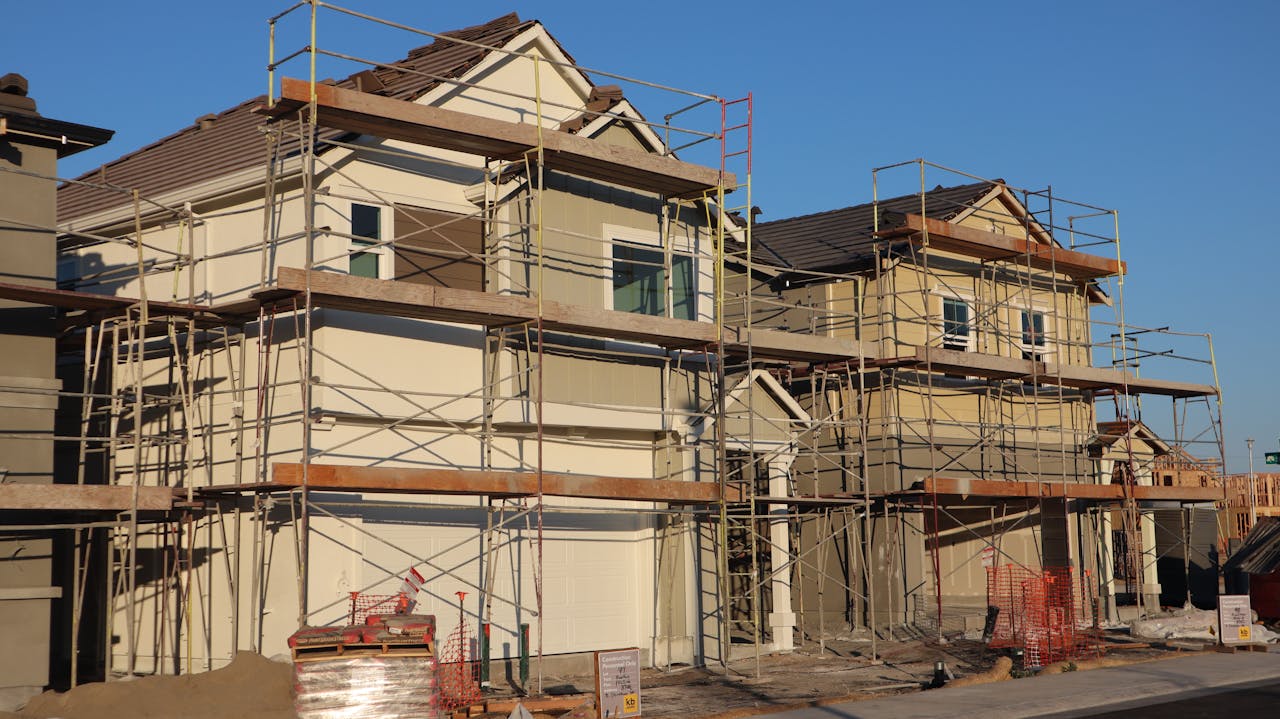
Housing Costs Keep Redrawing the Map

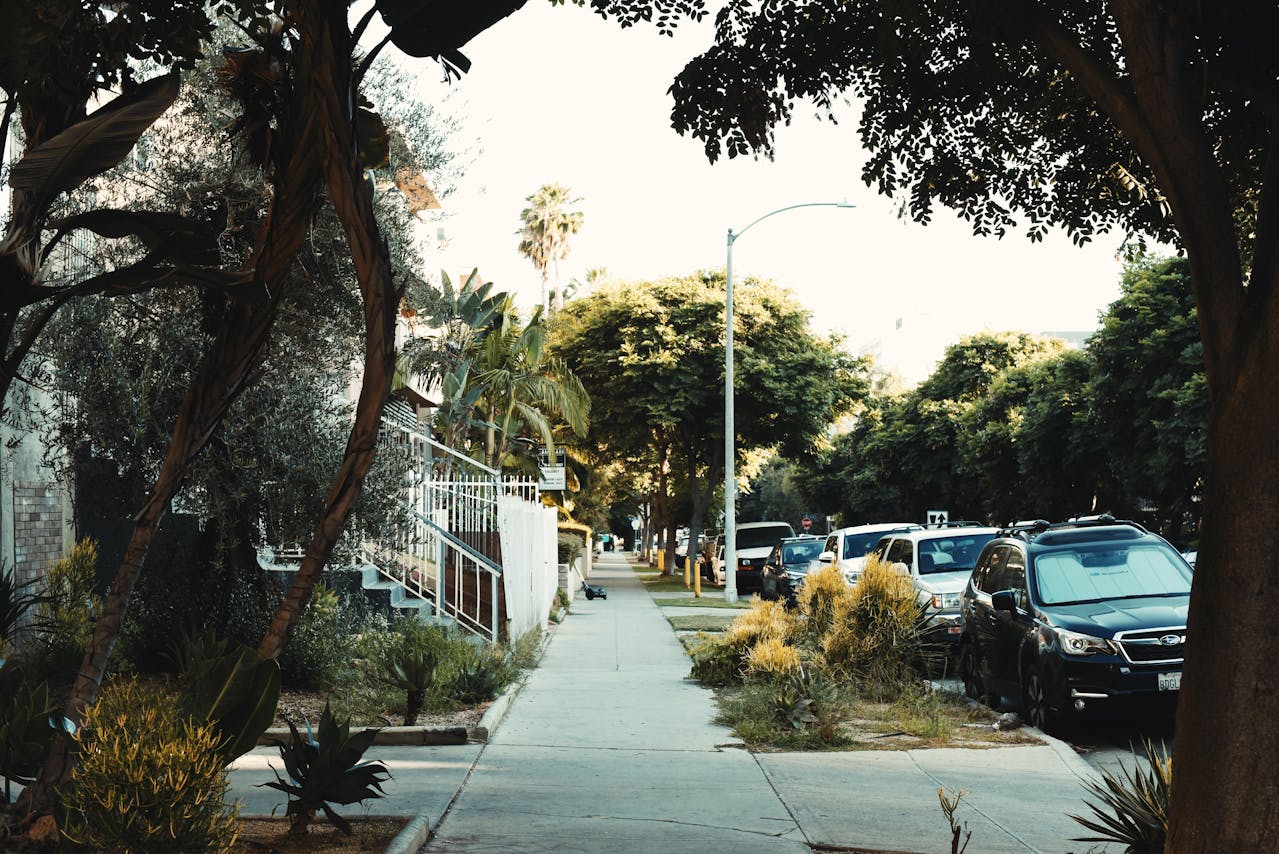
Housing remains the strongest force behind where people stay and where they go. In third-quarter 2025, only 17 percent of California households could afford the state’s median-priced single-family home, with a qualifying income of $223,600. Even with slight improvement from prior quarters, affordability stayed near historic lows.
That pressure turns ordinary decisions into long calculations. Families extend commutes, share housing across generations, or postpone moving to stay close to work and school. Population change becomes visible in lease turnover, school transfers, and weekend traffic long before it appears in policy debates.
Remote Work Changed Migration Timing

Remote work reshaped California migration by loosening the tie between job location and home location. PPIC reports that losses of higher-income households eased after the pandemic spike, yet domestic outflow remains a durable part of the state pattern. Flexibility changed who can leave and when.
That shift now sits inside daily routines. Older office districts see different weekday spending, while suburban and exurban neighborhoods absorb more daytime activity. Coffee shops, childcare schedules, and local transit demand reflect a workweek no longer tied to one center. Population movement now follows login time as much as commute lanes.
International Arrivals Steady the Totals
International migration has become the clearest stabilizer in California’s recent totals. State estimates show net international migration at 126,000 in 2024-25, while net domestic migration remained negative. That combination helps explain why statewide numbers can edge up even as many households continue leaving for other states.
On the ground, the effect appears in neighborhood commerce and public services. Main streets adjust quickly to changing language needs, food demand, and community programming. What looks complex in a chart often feels direct in practice: schools and businesses responding fast to who now lives nearby.
Aging in Place Is Reshaping Community Needs

California is also feeling a slower, deeper shift: aging in place. PPIC’s 2026 fact sheet reports that 16.5 percent of residents were 65 or older in 2024, and state projections place that share near one in four by 2050. This trend changes local priorities whether a county is growing, flat, or shrinking.
Communities feel it through longer healthcare waits, stronger demand for accessible housing, and more pressure on caregiving networks. Planning debates once centered almost entirely on enrollment now include mobility, safety, and social support for older adults. The population story is not only about movement. It is also about duration.
Family Life Now Spans More States

Interstate movement has stretched California family networks across a wider map. PPIC reports that from 2010 through 2024, nearly 10 million people moved from California to other states, while just over 7 million moved in from elsewhere in the country. That gap reshapes everyday relationships.
The emotional effect is subtle but persistent. Milestones that once happened across town now depend on flights, shared calendars, and advance planning. Care responsibilities are harder to coordinate, and holidays carry more logistics than spontaneity. Population change appears as distance management: staying close while living farther apart.
County Growth and County Losses Feel Different
County trends reveal why Californians can report opposite realities in the same year. PPIC notes that only 21 of 58 counties have grown since the 2020 census period, with strong gains in some inland areas and major losses in Los Angeles County. A single statewide label cannot capture that divergence.
People feel this in public investment patterns. Faster-growing counties debate road capacity, school expansion, and utility upgrades, while slower-growing areas focus on vacancy, fiscal pressure, or service consolidation. Both realities are current, both are real, and both shape routine life. The state is not moving in one direction.
Growth Returned, but Confidence Stayed Cautious
California’s population is growing again, but the pace remains thin enough to feel fragile. Department of Finance estimates place the 2024-25 increase at 0.05 percent, following pandemic-era losses and a multiyear rebound. Growth exists, yet it no longer arrives with broad confidence for many communities.
The lived result is a mixed civic mood. Some residents read the return to growth as stability, while others experience churn in housing, schools, and local business turnover. Both readings can be true at once. Everyday California now runs on adjustment: small shifts repeated until the social map looks noticeably different.