Street risk is often narrated like a thriller: a shadowy stranger, a sudden grab, a city spiraling. Data tells a quieter story. Surveys and safety reports show that harm is shaped by routine, lighting, traffic, and social ties, not pure randomness. The gap matters because attention is limited. When fear points one way and numbers point another, prevention gets mis-aimed, and real hazards stay unaddressed. These nine contrasts keep the focus on what repeats. Headlines reward extremes, so the brain expects extremes. On blocks, risk is measurable: fast cars, dark crossings, and disputes that escalate. That match makes safety sharper.
Stranger Danger Is the Whole Story
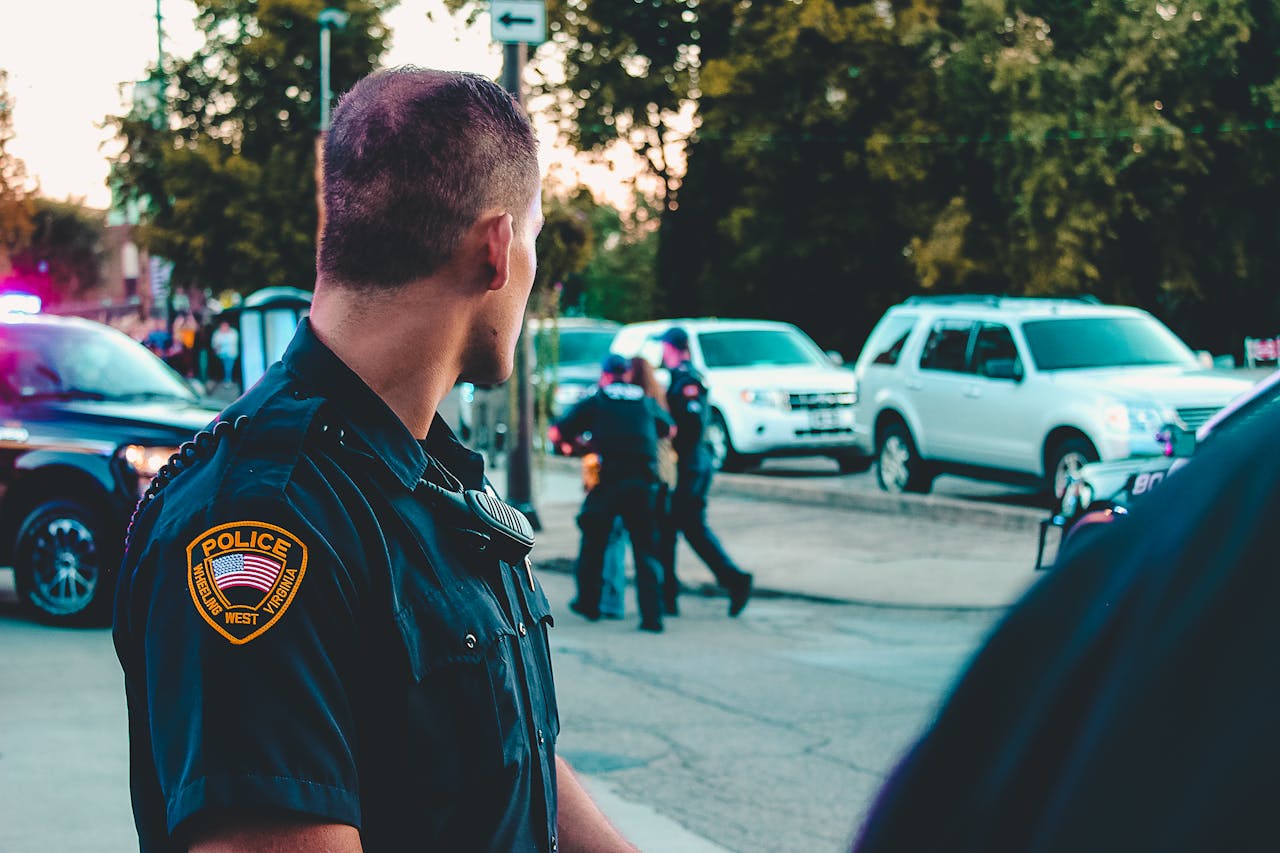
The sidewalk story often centers on a stranger, but the numbers split the picture. National victimization data shows violence by strangers and by people known to the victim both contribute to the total, and most violent incidents are assaults, not the rarest headline crimes. That matters for street sense because many incidents start as friction: a glare, a shove, a dispute over space, then a quick swing. Good prevention is boring: avoid bottlenecks, keep distance from arguments, and leave early when tension is rising. The goal is not suspicion of every passerby, but awareness of cues that show when a scene is changing.
The Biggest Street Threat Is Crime

Street fear often points to crime, yet a large share of street harm comes from traffic. U.S. safety reports count thousands of pedestrian deaths in a single year, heavily concentrated in urban areas, often away from intersections and in low-light conditions. A hit-and-run driver or a speeding vehicle on a wide arterial is not a rare, random threat; it is a repeating pattern tied to design, visibility, and enforcement. The data points to the same fixes: slower speeds, brighter crossings, and safer midblock options where people actually cross. When attention stays on strangers, these hazards get a pass. and calmer streets.
Stranger Kidnappings Are Common

Few fears hit harder than the idea of a child taken by a stranger, and that intensity can drown out frequency. National missing-children casework shows nonfamily abductions are a small fraction of reports compared with runaways and family-related situations, even though they dominate public imagination. In practice, many missing episodes start with conflict, stress, or a teen leaving without a plan. This framing does not soften tragedy, but it shifts prevention toward communication, check-ins, and early reporting when something breaks pattern. It keeps fear from turning every person nearby into the assumed culprit.
Trafficking Looks Like a Street Grab

Trafficking is often pictured as a sudden snatch from a curb, but many experts describe a different pattern. Many cases involve grooming, deception, debt pressure, threats, and control over documents or housing, not a dramatic abduction. That distinction matters for street perception: warning signs can look like isolation, someone else speaking for an adult, restricted movement, or a person who seems monitored rather than lost. Real prevention leans on trust, reporting paths, and support services that make leaving possible. Myths favor cinematic danger and miss the quieter controls that keep exploitation in place.
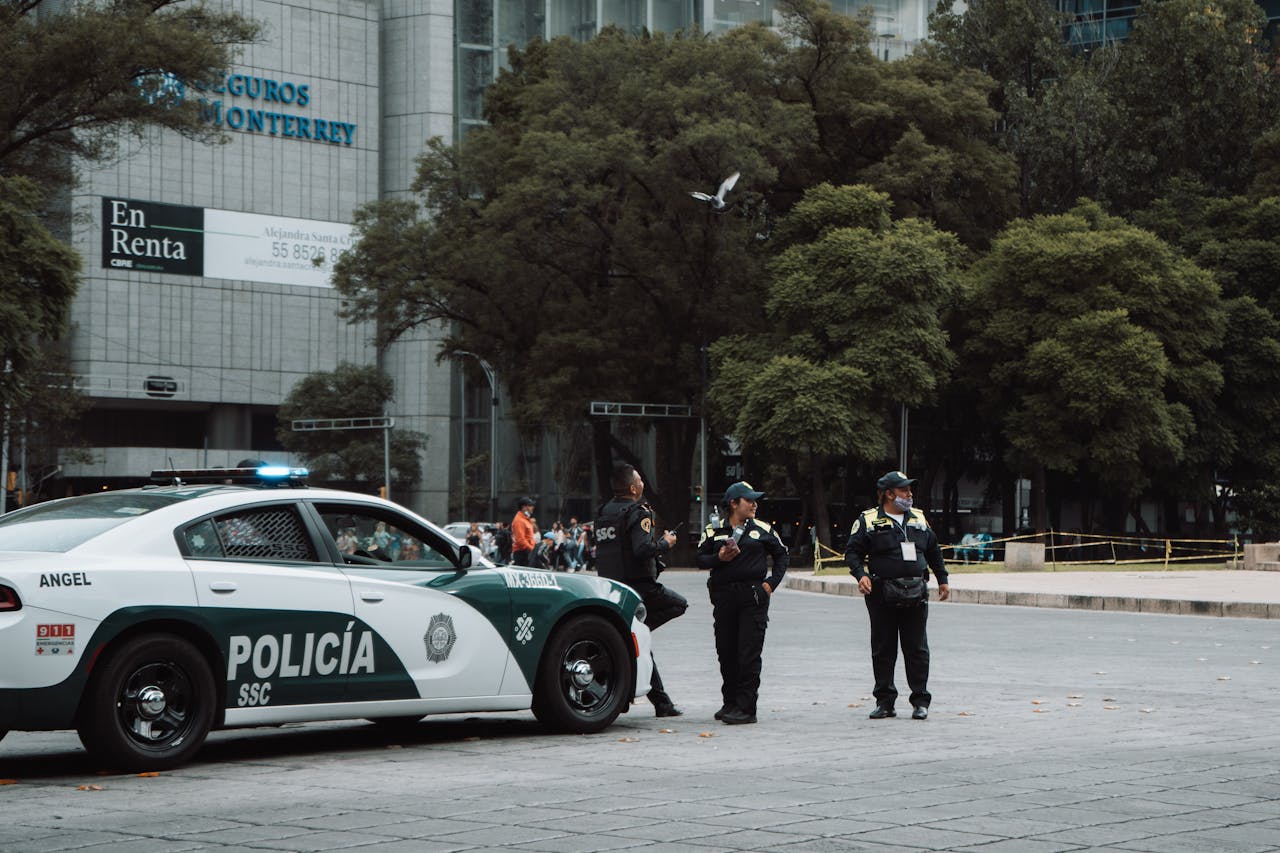
Crime Is Rising Everywhere, All the Time
After a viral clip, it can feel like every block is sliding into chaos. National reporting does not support that constant-rise story. Recent FBI estimates show violent crime trending downward year over year, while victimization surveys suggest many rates hold steady rather than spike everywhere at once. The key is that street risk is uneven: one neighborhood can heat up while a citywide average cools. Clear thinking separates national direction from local pockets, then checks matching dates and definitions before drawing conclusions. Perception lags because dramatic incidents travel farther than ordinary weeks that pass quietly.
Mass Shootings Describe Everyday Street Risk

Public shootings shape how street danger is imagined, yet the broader firearm picture is dominated by other outcomes. National mortality summaries show firearm deaths are more often suicides than homicides, which changes what prevention looks like at the population level. Mass shootings are devastating, but definitions vary, and the events represent a small share of total firearm deaths compared with everyday self-harm and interpersonal violence. That does not minimize fear; it redirects focus toward crisis support, safe storage, and conflict interruption alongside public-space planning. Clarity comes from sizing threats correctly.
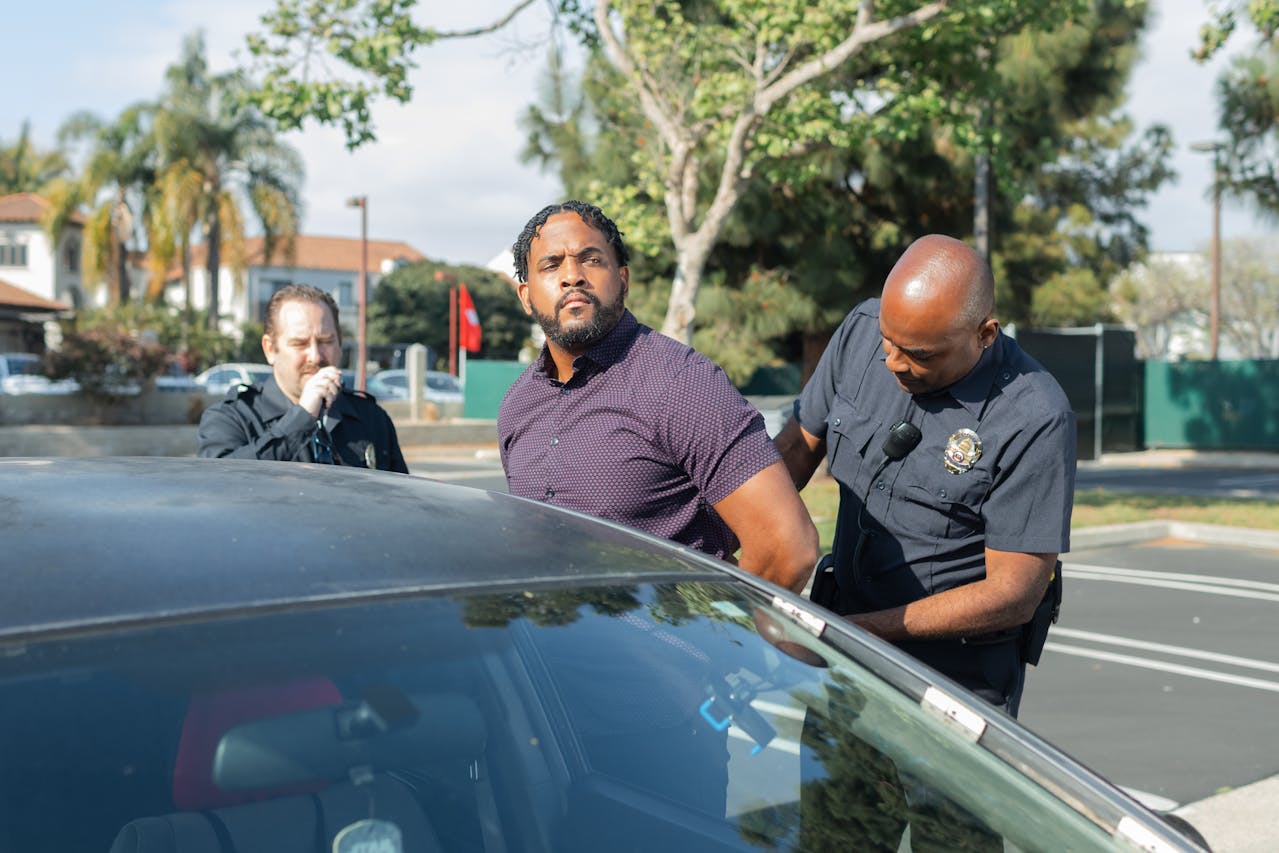
Police Reports Equal the True Level of Street Crime

Street crime is often measured by police reports, but reporting rates leave a shadow. Victimization surveys show many incidents never reach law enforcement, and reporting can swing year to year by offense type and trust. When reporting drops, official numbers can look calmer than lived experience. When reporting rises, a neighborhood can look worse on paper simply because more people came forward. That is why trend arguments get messy: behavior, reporting, and enforcement all move the totals. The cleanest read blends official data with survey context and asks what changed first. Otherwise, risk becomes a debate about paperwork.
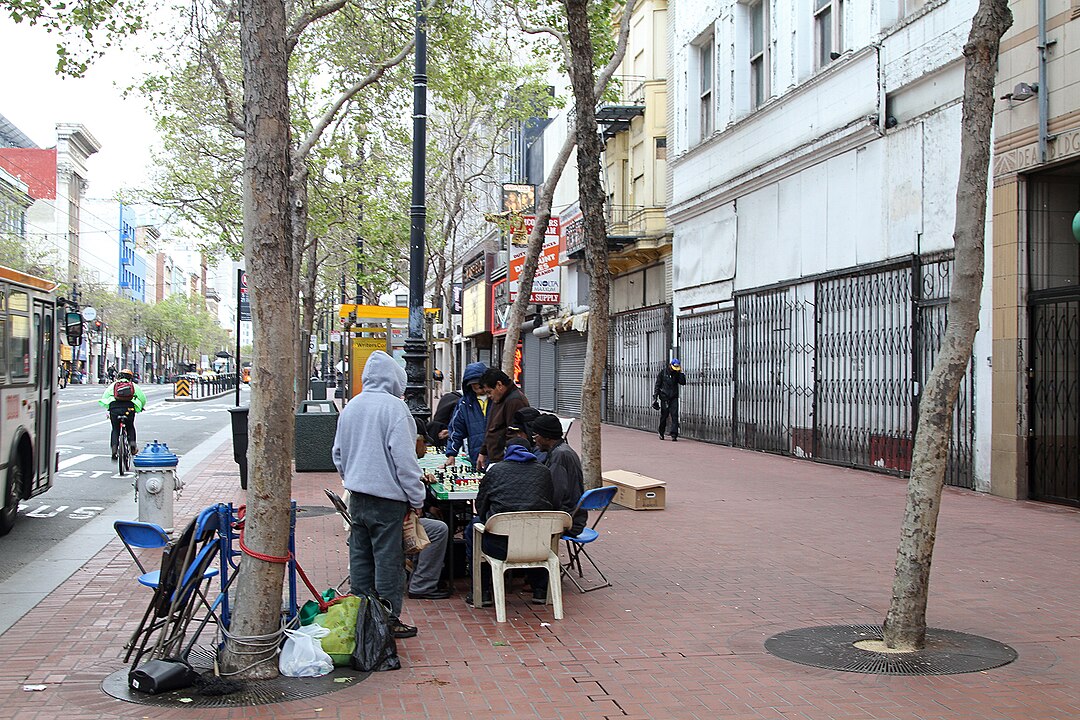
Cities Are Unsafe By Nature
City danger is often treated as a personality trait, as if density guarantees harm. The better read is conditional: victimization rates can be higher in urban areas, but the drivers are specific and changeable. Property crime can rise with opportunity and foot traffic, while violence can cluster around a few corridors, times, and settings. Data also shows that many places see little change year over year, which undercuts the idea of an unstoppable slide. Labeling a whole city unsafe blurs the map. Naming the blocks, hours, and causes is what allows improvement. Precision beats panic, and it leaves room for real fixes.
Street Conflict Usually Ends in the Worst Outcome
Street conflict talk often collapses into the worst possible ending, but most incidents do not end there. Homicide counts are tragic, yet the larger pool of violent victimizations includes far more assaults and threats than deaths. That gap matters because it highlights what can be prevented at scale: quicker separation, bystander intervention that defuses rather than inflames, and environments that make it easy to exit. When harm is framed only as the rarest outcome, everyday injuries become invisible. Seeing the full distribution does not lower concern; it improves strategy and keeps resources aimed at the most frequent pathways.