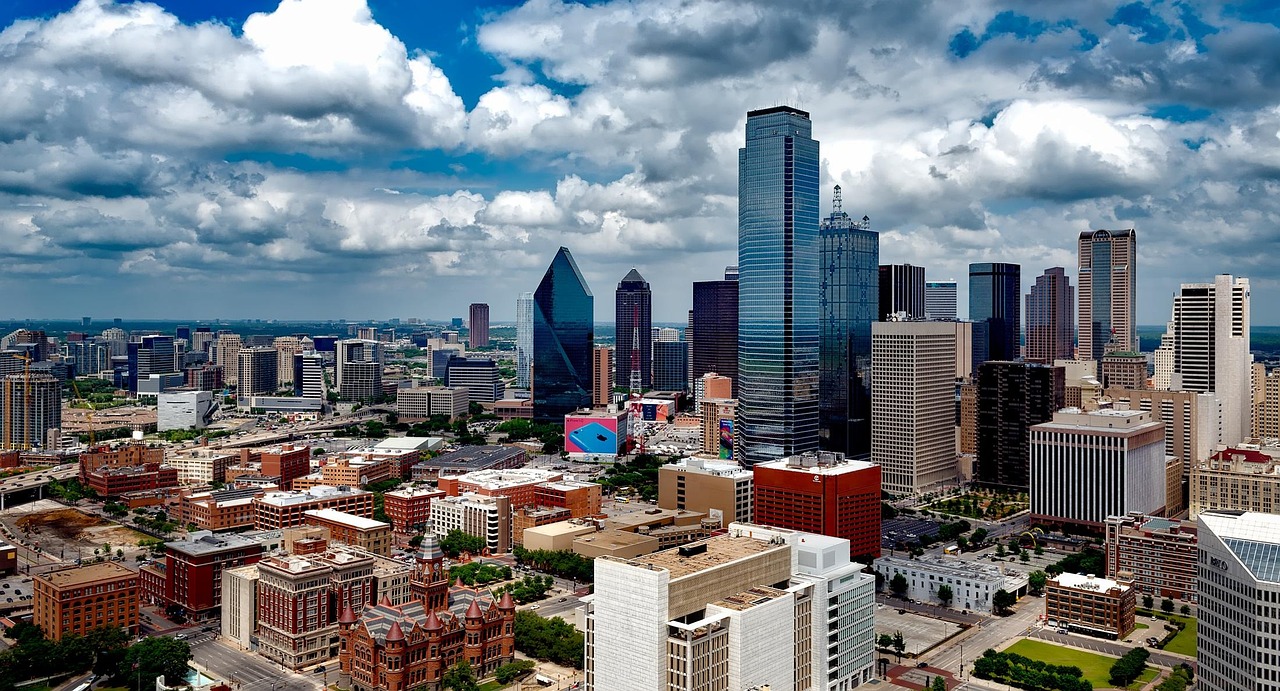
Air felt heavier than usual across pockets of East Texas early Tuesday. Forecast notes and live maps flagged fine particle pollution at levels that can irritate lungs, cloud views, and sap energy. For families with older adults, little kids, or anyone managing asthma, the guidance was simple and a bit sobering: move activities inside, slow down strenuous plans, and give your body less to fight. The alert wasn’t about panic. It was about pacing the week with cleaner air in mind.
Here’s the thing. When tiny particles spike, the risk doesn’t always look dramatic from the porch. PM2.5 is microscopic, slips past filters in the nose and throat, and can inflame airways within hours. The Air Quality Index puts numbers and colors to that risk so people can read conditions quickly and adjust. This week, several communities east of Longview hit markers that made indoor time the smarter choice, especially for sensitive groups.
Why East Texas Air Turned Problematic
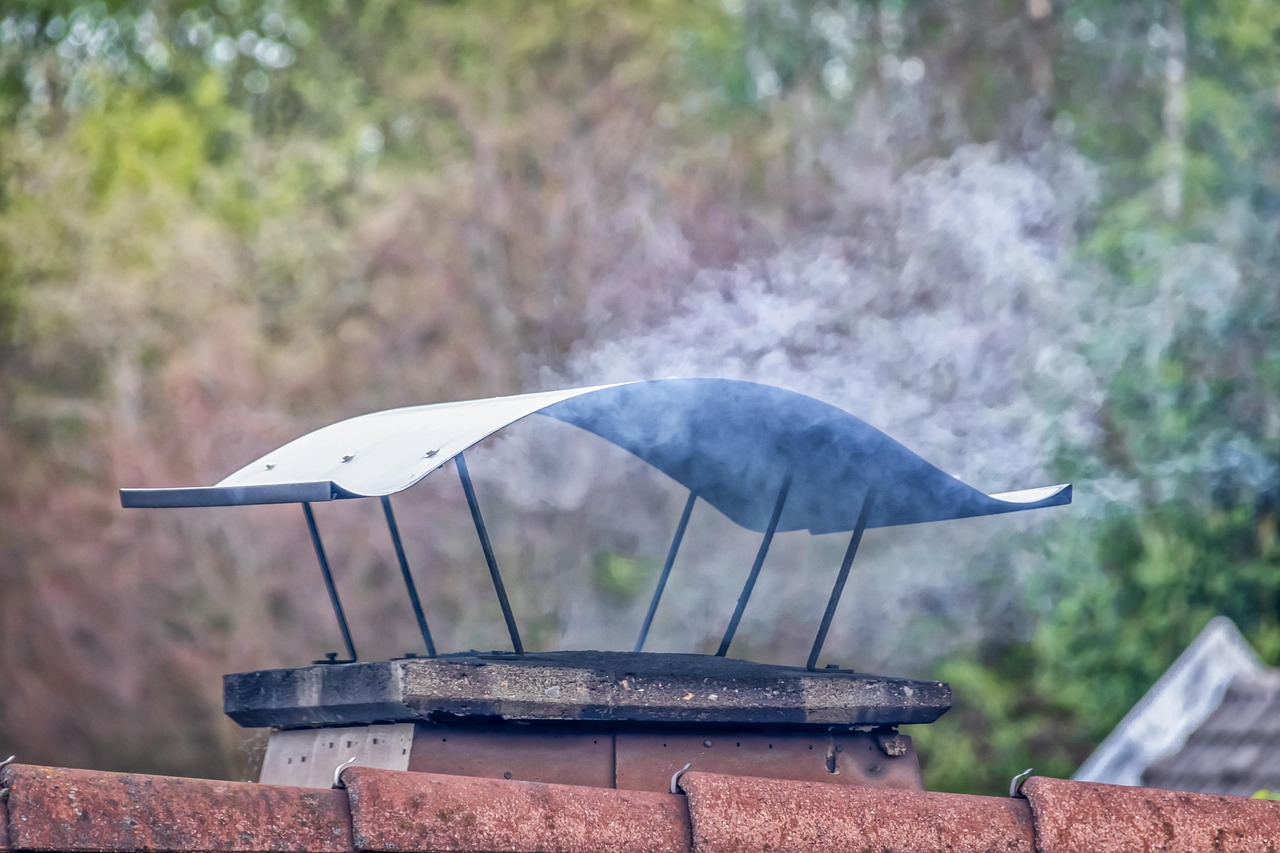
Analysts pointed to a mix of lingering smoke from scattered burning across portions of the Southeast and light winds that let urban background particulates hang around. Add intermittent industrial smoke over the Permian Basin and you get pockets of elevated PM2.5 drifting and settling through the morning. It’s a familiar pattern in fall, when stable air layers can trap pollutants near the surface.
This isn’t a single-source story. The forecast language highlights residual smoke from multiple regions plus local contributors, which means conditions can change block by block and hour by hour. That’s why statewide maps and metro forecasts matter. They pair the regional picture with local monitors so people aren’t guessing from a headline alone.
AQI, Decoded

Think of the AQI as a health scoreboard from 0 to 500. Green is good. Yellow is moderate. Orange means unhealthy for sensitive groups. Red means unhealthy for more of the public. Purple and maroon signal very unhealthy and hazardous. As the number climbs, so does the likelihood of symptoms and the need to change plans.
Two quick anchors help. Unhealthy for sensitive groups usually starts at 101. Unhealthy begins at 151. If you see those colors on the map, it’s time to reconsider outdoor workouts, school sports intensity, or long errands.
The index isn’t a vibe check. It’s a standardized scale built by EPA so ozone in Austin and PM2.5 in Marshall are translated to the same health language. That lets forecasters communicate risk clearly, even when the underlying pollutant differs.
For PM2.5 specifically, recent EPA documents outline the breakpoints behind the categories, keeping the scale consistent as science evolves. That ensures today’s orange in East Texas means what orange should mean, not guesswork.
Health Risks Pile Up Fast
Fine particles irritate the nose and throat first, then can trigger coughing, chest tightness, or wheeze. For people with asthma, COPD, or heart disease, that irritation can escalate into real trouble. Even healthy adults feel it as fatigue, a dull headache, or a run that suddenly feels harder than it should. The point of the AQI is to warn before those sensations stack up.
Pediatricians and pulmonologists lean on the same playbook: reduce exposure, hydrate, and keep rescue medications close if prescribed. Schools and teams can shift practicing times, shorten drills, or move indoors. None of it is dramatic. It’s preventive care, scaled to a neighborhood.
Where The Spike Hit Hardest
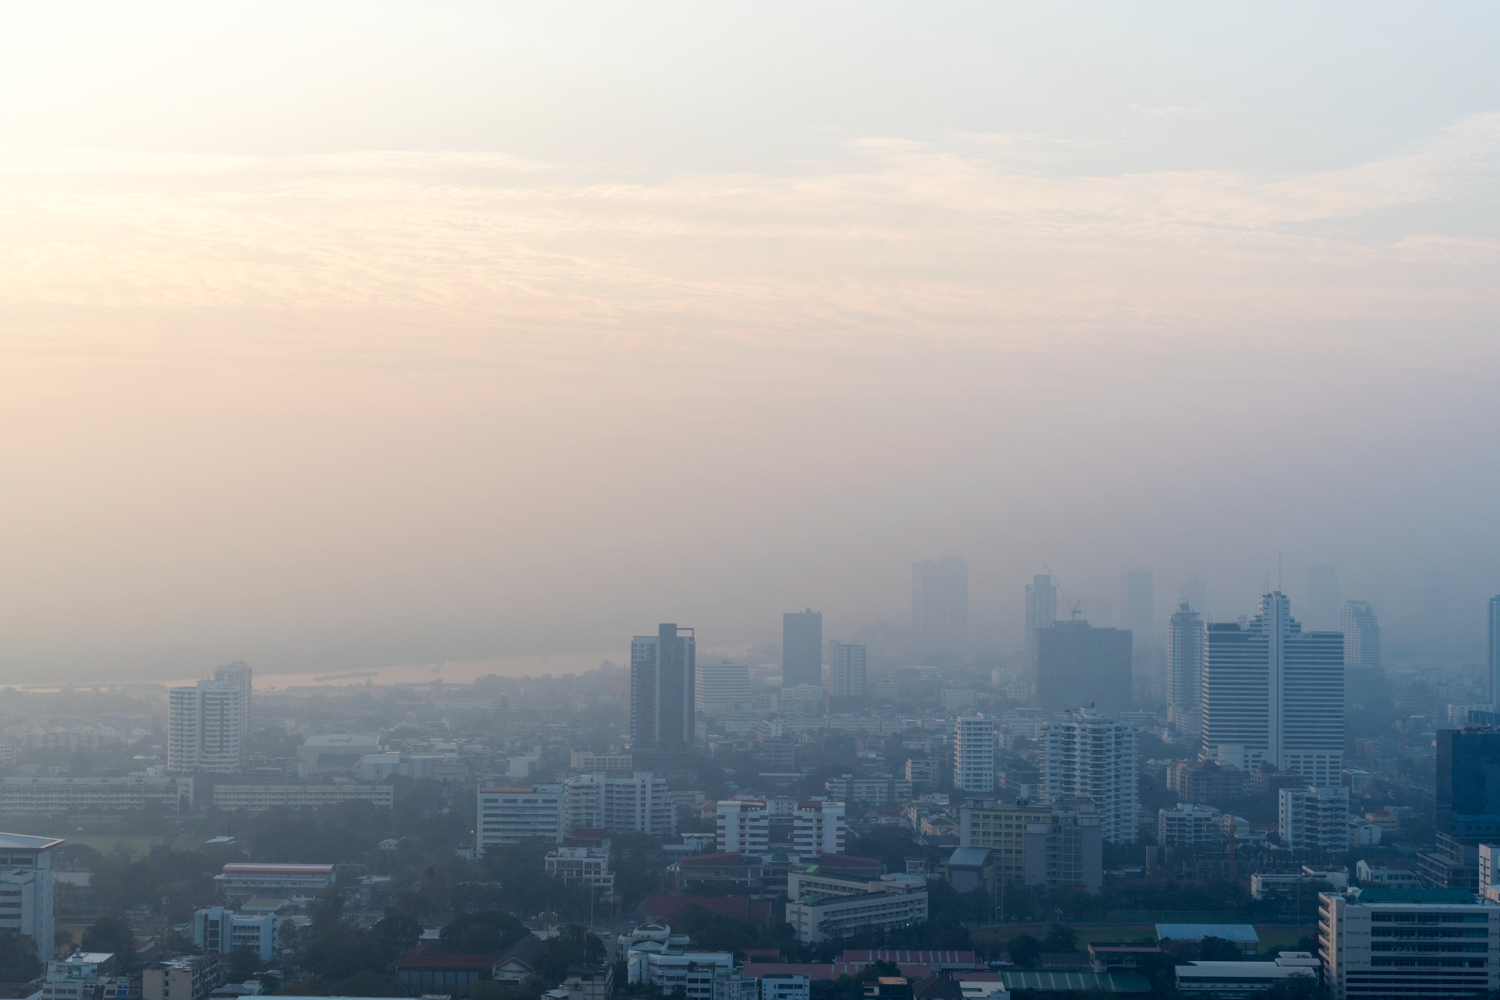
Early Tuesday’s mapping called out a cluster east of Longview, including Jefferson, Harleton, Marshall, and Scottsville. These are communities tied by highways, timber, and small-town routines, so the ripple was practical: parents adjusting school-day plans, workers timing commutes, and coaches weighing practice intensity.
Shorter drives didn’t always mean safer air, either. Light winds and local topography can pool particulates in low spots before mixing out later in the day. The upshot is uneven conditions that reward checking the map again after lunch.
Some metro dashboards showed gaps or delayed readings, which happens when stations report on a schedule or maintenance is underway. That’s where the statewide forecast fills in, blending monitors, models, and satellite smoke analysis.
And over the Permian, intermittent industrial smoke added another variable, nudging PM2.5 upward at times even when winds were light. Forecasts flagged it so the public could plan around brief bumps rather than be surprised by them.
What To Do Inside This Week
Close windows during spikes and run a portable air cleaner if you have one. If not, a DIY box-fan filter can help in a pinch. Keep indoor activity mellow for anyone who starts coughing or feels tight-chested. If your home gets stuffy, ventilate when the AQI dips, then seal back up. It’s about timing, not living in a bubble.
Medications, spacers, and action plans should be easy to reach. Check school and workplace notes for any temporary changes to outdoor periods or physical training. Simple adjustments reduce symptoms without derailing the day.
If You Must Be Outside
Pick the lower-AQI windows. Morning and late evening can vary, so check the map, then go. Dial back intensity, add breaks, and keep activities shorter than usual. If smoky odors are obvious or your chest feels tight, that’s your cue to head in.
Masks that seal well, like N95s, filter fine particles better than cloth face coverings. They help most during short outdoor tasks when the index is high. They’re not forever gear; they’re a tool for a rough patch of air.
How To Track The Next Shift
Start with the Texas forecast page. It blends monitors and modeling and explains what’s driving changes, from regional smoke to local stagnation. The narrative helps make sense of numbers so you can plan the day.
Pair it with the national map to see the bigger flow and any upwind smoke that could arrive overnight. If you click into city reports, remember that not all stations post at the same cadence, so look at both current AQI and the forecast.
If you need data beyond a glance, EPA’s AirData tools let you pull hourly and daily histories. That’s useful for schools, clinics, or newsrooms documenting patterns and deciding when to adjust routines.
Sources
Key guidance and real-time conditions came from statewide forecasts and national AQI resources: Texas Commission on Environmental Quality for today’s outlook and drivers; AirNow and EPA for category meanings, health context, and mapping.
For localized alerts and reporting on the East Texas spike, see coverage that summarized the early-Tuesday hotspots around Jefferson, Harleton, Marshall, and Scottsville, and cross-check against the live map before planning outdoor time.