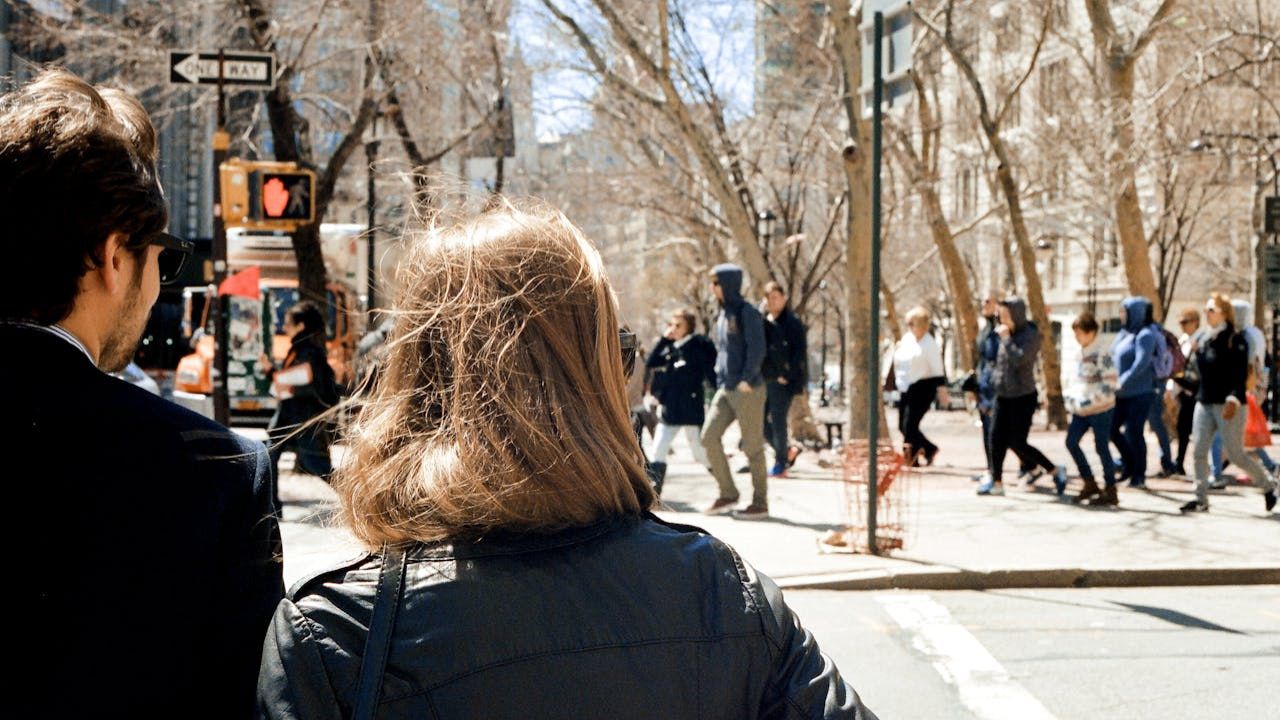
If you walk or bike in American cities, some places are riskier than others. A recent nationwide study ranked nearly 300 cities for how dangerous they are for pedestrians and cyclists, combining crash data, infrastructure, and fatality rates. New York City ranked among the safest major cities, while Baton Rouge and Tucson topped the danger list.
This article explains what made cities dangerous, what NYC is doing right, and what you should look out for in your own city or town.
How the study ranked cities
The study used data from U.S. traffic safety reporting systems, focusing on pedestrian and bicyclist deaths by city. They normalized those figures by population, compared results to state averages, and added infrastructure scores for sidewalks, bike lanes, and crosswalks.
They assigned a “risk score” out of 100, where higher scores mean more hazard. Pedestrian and bicycle risks were measured separately, then combined to a total risk. According to media reports based on the study, New York City landed among the safest in the nation in this ranking.
The most dangerous cities for walkers and bikers
Among the top cities with highest combined risk scores are:
- Baton Rouge, Louisiana
- Tucson, Arizona
- Jacksonville, Florida
- San Bernardino, California
- Las Vegas, Nevada
- Albuquerque, New Mexico
- Detroit, Michigan
- Tampa, Florida
- Glendale, Arizona
- Phoenix, Arizona
These cities often feature wide roads, high speeds, few protected walking or biking pathways, and lower law enforcement of crosswalks. Risk is concentrated in certain zones—arterials, industrial corridors, or areas lacking safe crossings.
Why some cities are more dangerous
Several traits tend to appear in higher‑risk cities:
- Fast traffic lanes close to sidewalks with little buffer
- Infrequent crosswalks or drivers ignoring them
- Few or unprotected bike lanes
- Poor street lighting
- Lack of traffic calming (such as speed bumps or narrower lanes)
- Rapid urban growth without corresponding safety planning
Even cities that invest in infrastructure can rank high if they do not control speed or enforce safe driving behavior. Good pathways don’t fully protect you if cars zoom by.
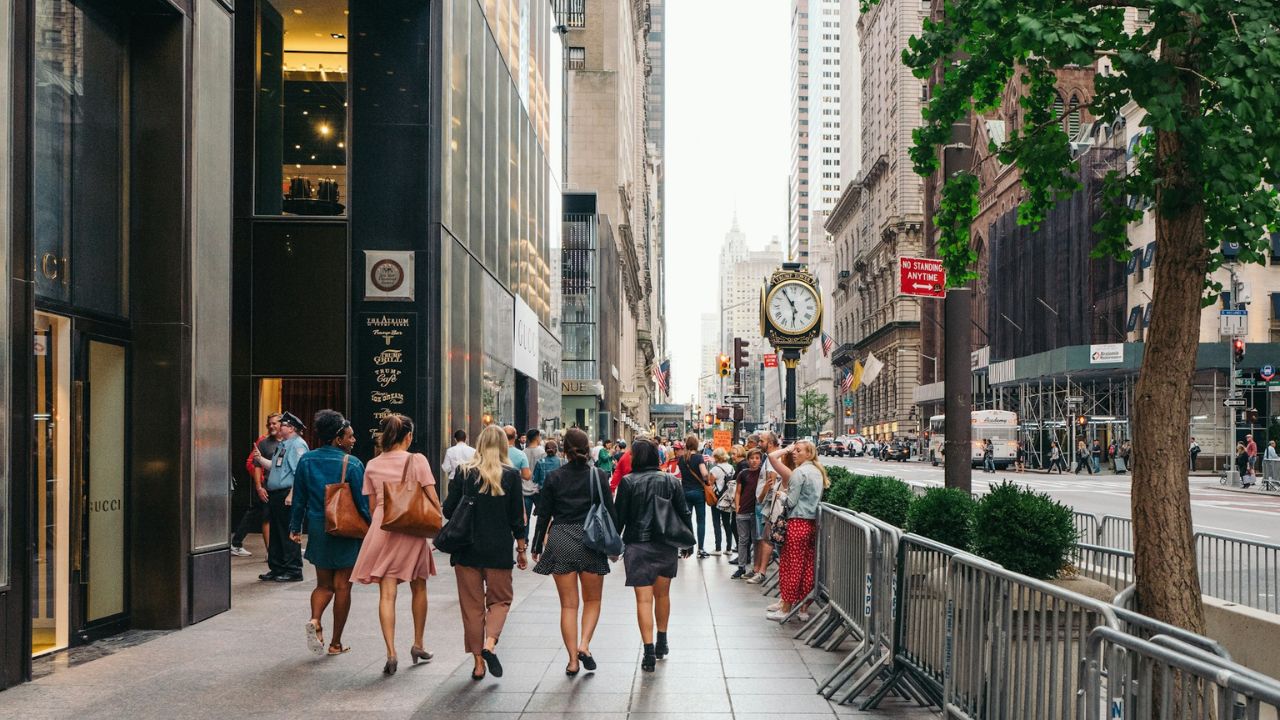
NYC’s safer status (and remaining danger zones)
New York stands out for having relatively low fatality rates for walkers and bikers compared to many peers. Its infrastructure helps: hundreds of miles of bike lanes (many protected), pedestrian head starts at signals, Vision Zero policies aimed at eliminating fatalities, and consistent enforcement in high‑demand areas.
But New York is not uniform. Certain corridors like Queens Boulevard have long histories of pedestrian injury. Some wide boulevards and neighborhoods still feel hostile to crossing without signal or delay. The contrast is stark. In safer neighborhoods, you often see layered crossings and refuge islands. In trouble spots, fewer protections make mistakes feel costlier.
Another advantage is exposure. Large portions of New Yorkers walk or cycle as part of daily routines, particularly in dense districts. That exposure means more safety measures are justified and more visible. When people see safe crossings or protected lanes, the feedback loops support maintenance and improvement.
What you should look for where you live
Even if your city is not ranked among the worst, risk can vary block to block. Use danger city profiles as clues, then examine your own streets:
- Are crosswalks frequent and respected?
- Do bike lanes exist, and are they physically separated or buffered?
- Are street lights adequate at night?
- Are speed limits low and traffic calming in place in residential zones?
- Are parking and visibility controlled at intersections?
If many of those are missing, the roads around you may share risk factors with top‑ranked cities.
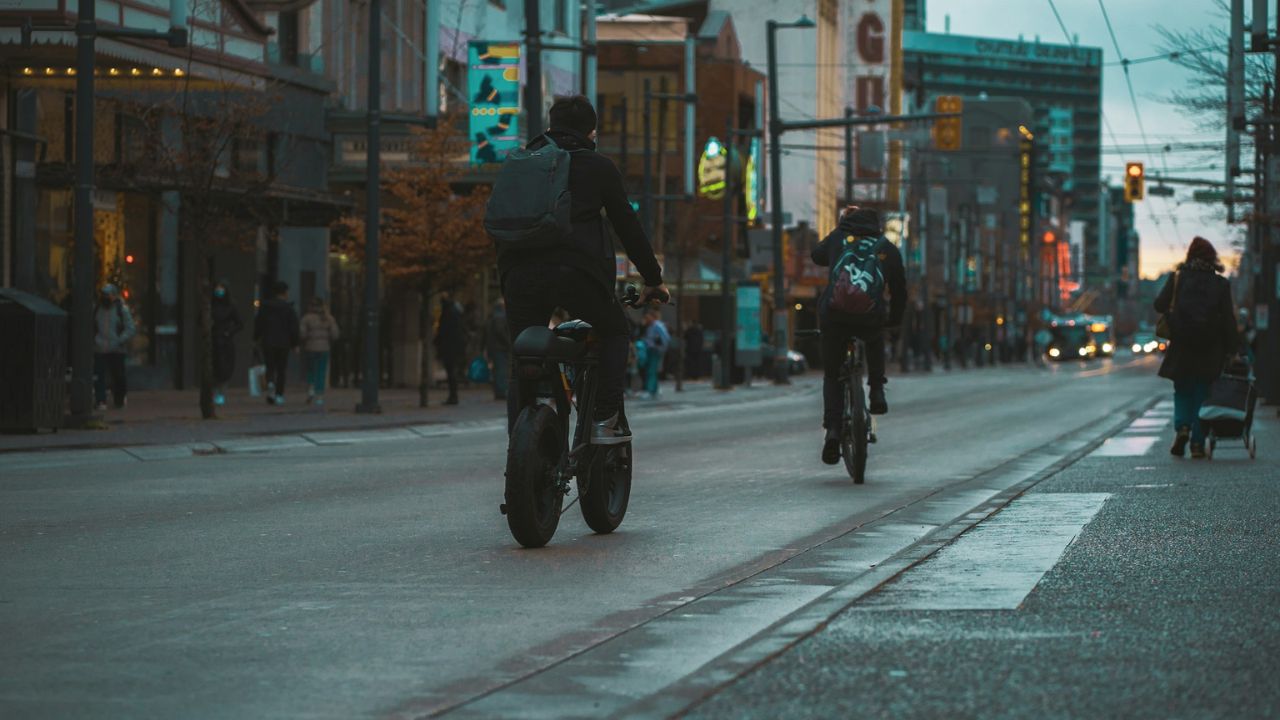
What walkers and bikers can do
You cannot control every variable, but you can protect yourself:
- Use marked crossings and wait for walk signals.
- Wear bright or reflective clothing, especially after dark.
- Ride defensively as if drivers may misjudge your speed.
- Use bike lanes where available and avoid car doors by riding a bike’s width away from parked cars (“door zone”).
- Assume drivers may not see you—make eye contact when possible.
- Plan safer, longer routes if necessary to avoid high traffic roads.
- Learn your local crash statistics. Cities often publish hot‑spot maps; avoid paths with frequent incidents.
The bigger picture
Cities today are shaped by how we built roads, zoned neighborhoods, and prioritized vehicles over people in the last century. The most dangerous places reflect older designs meant for speed. Safer cities show what happens when priorities shift: slower streets, better crossings, protected paths, and enforcement.
New York shows that larger, dense places can deploy safety without losing mobility. But even it retains gaps. The hope is that walking and biking could become the safer default, not risky options. Teens who observe road safety, advocate for better design, or choose safer routes already help shape that shift.
Sources
- Wagner Reese, Most Dangerous U.S. Cities for Cyclists & Pedestrians (2025) — methodology and rankings of nearly 300 cities Wagner Reese
- The Independent, “The best and worst US cities for pedestrians and cyclists” (2025) — ranking summary including top 10 danger list The Independent
- NYC DOT, “Road Safety Plan” — fewer fatalities compared to peer U.S. cities NYC Government