Highway driving keeps getting faster while city streets trend slower. Out on wide open interstates you now see 80 posted across several states, and one engineered stretch in Texas goes even higher. Roll into town and the tone shifts. Twenty is plenty campaigns, new crosswalk islands, and tighter lanes nudge speeds down where people live, walk, and bike.
These two movements are not at odds. They solve different problems. Rural freeways prioritize flow across long distances with generous sightlines. Neighborhood streets prioritize survival when things go wrong. The result is a map with faster tops in the countryside and calmer targets in dense places.
How speed limits are actually set
For decades many agencies leaned on the 85th percentile rule. Measure free flow, find the speed most drivers already choose, and post near that number. It is simple and often works on freeways.
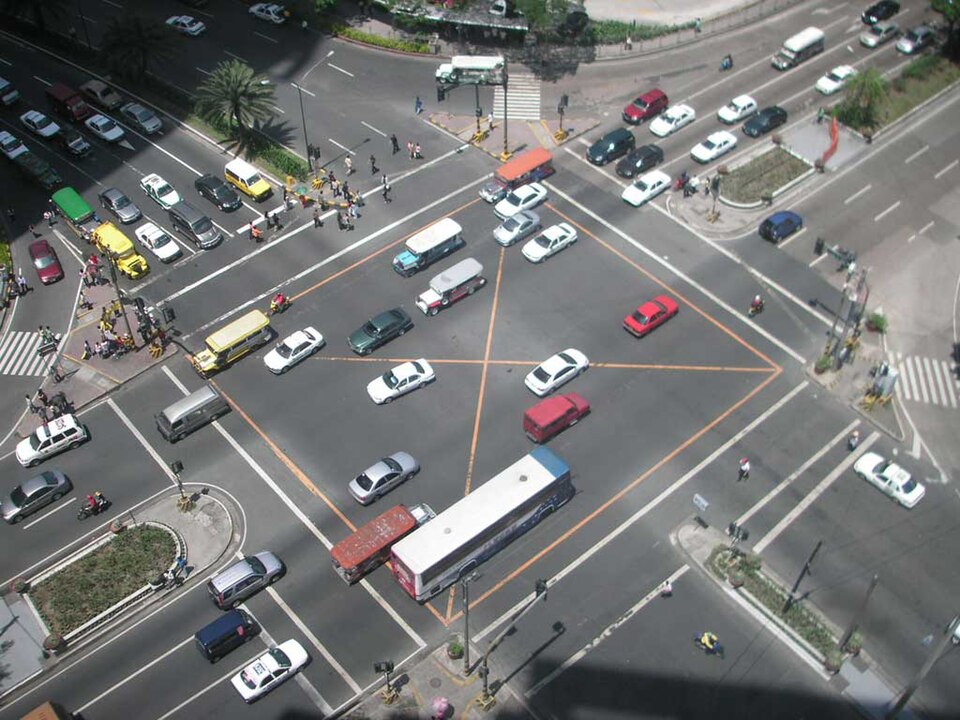
Urban streets are different. People walking, biking, and crossing at midblock change the risk math. A speed chosen by drivers alone can be unsafe for everyone else.
New federal guidance now asks engineers to weigh context, crash history, land use, and design before posting limits. That gives cities permission to set numbers that match real human stakes, not just what cars are doing in an empty lane.
Here is the practical shift. If measured speeds are too high for the street, redesign comes first. Narrow lanes, add islands, tighten corners, and the number on the sign starts to feel natural, not nagging.
Safety by the numbers
Speed affects both the chance of a crash and the harm when it happens. Small reductions bring shorter stopping distances and far fewer severe injuries. That is why many cities moved defaults from 30 to 25, or from 25 to 20 on residential streets.
In 2023, speeding was linked to roughly 29 percent of U.S. traffic deaths. The pattern is stubborn. The most reliable wins come from combining lower limits with physical changes that make fast driving feel uncomfortable.
Cities dialing down to 20
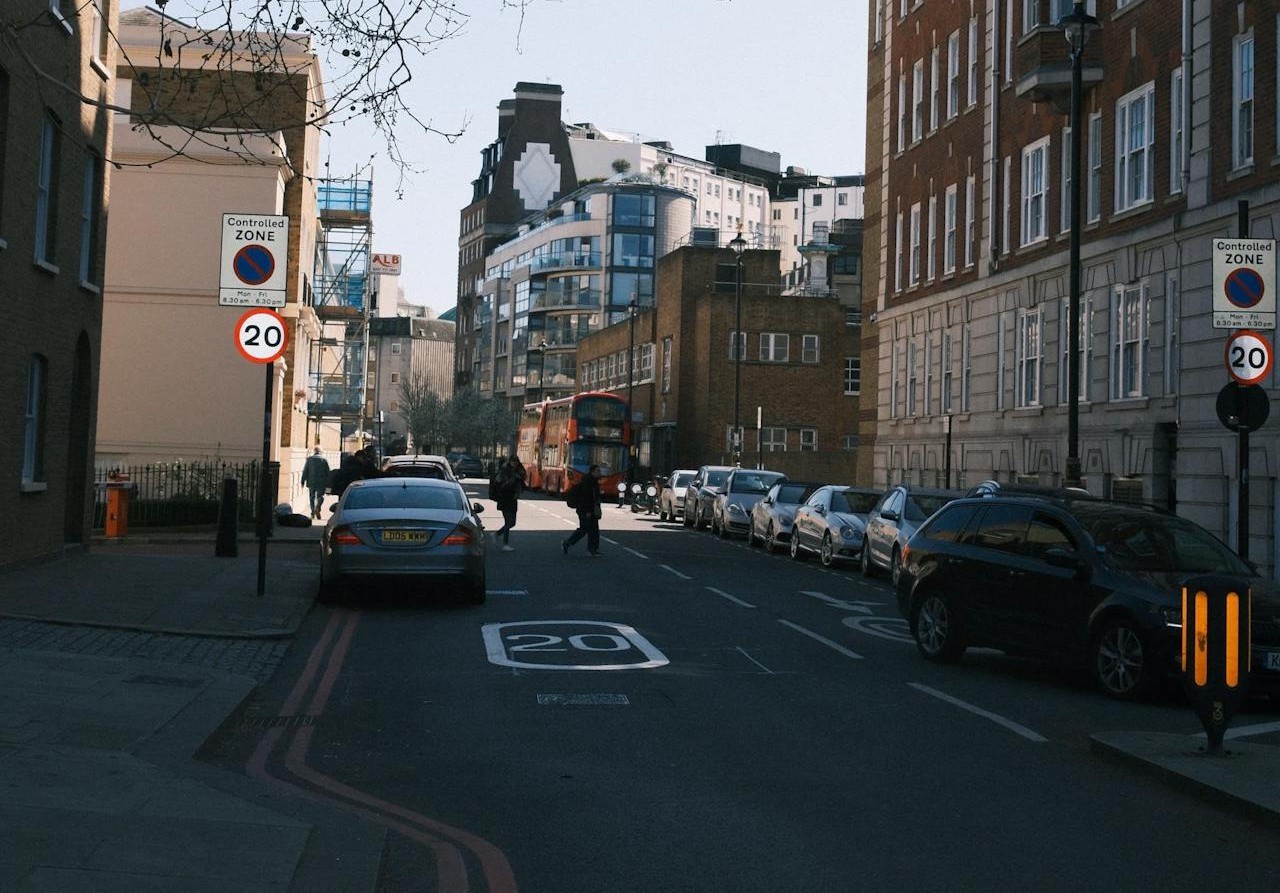
Washington DC set a 20 default on local streets and backed it up with targeted calming. The point is predictable outcomes in places full of people, not faster peak flows.
Portland pushed local streets to 20 and saw the worst speeding decline. Average speeds barely budged. The dangerous tail got trimmed, which is exactly the goal.
New York, Boston, and Seattle show similar lessons. Lower posted limits, more frequent crossings, and protected bike space reduce the share of drivers blasting past 30 and 35.
The takeaway is simple. If you want a 20 outcome, build a 20 street. Signs help. Design seals the deal.
Highways edging up to 80
At least nine states now allow 80 on select rural freeways. These segments tend to be straight, wide, and lightly populated. Long spacing and limited access keep conflicts low.
Texas stands out with one corridor signed at 85. It was built for that number with large radii and deep clear zones. The intent is safe speed at scale, not thrill seeking.
Research still finds a tradeoff. Every bump in maximum limits raises fatality risk at the system level. High standards reduce that cost, but they do not erase it.
Drivers feel the speed creep too. When limits rise to match operating speeds, many people go a little faster anyway. That is the feedback loop agencies try to avoid.
The 85th percentile meets its limits
The 85th percentile is a decent tool on limited access roads. On city arterials it can miss the point. Streets are not only for drivers, and survivable impact speeds for people outside cars matter more than driver comfort.
Recent policy reflects that reality. The rule is no longer king in federal guidance for urban settings. Context and design now sit higher on the checklist.
That change unlocks better sequencing. If the measured 85th is too high, the fix is to change the street so the safe speed feels right, then post accordingly.
Design before enforcement
Everyone in this debate agrees on one thing. Geometry drives behavior. Wide lanes and long straight blocks invite fast travel. Tight lanes, frequent crossings, and vertical deflection slow it down.
So cities pair lower numbers with curb extensions, refuge islands, protected bike lanes, and signal tweaks. Compliance improves without a ticket book at every corner.
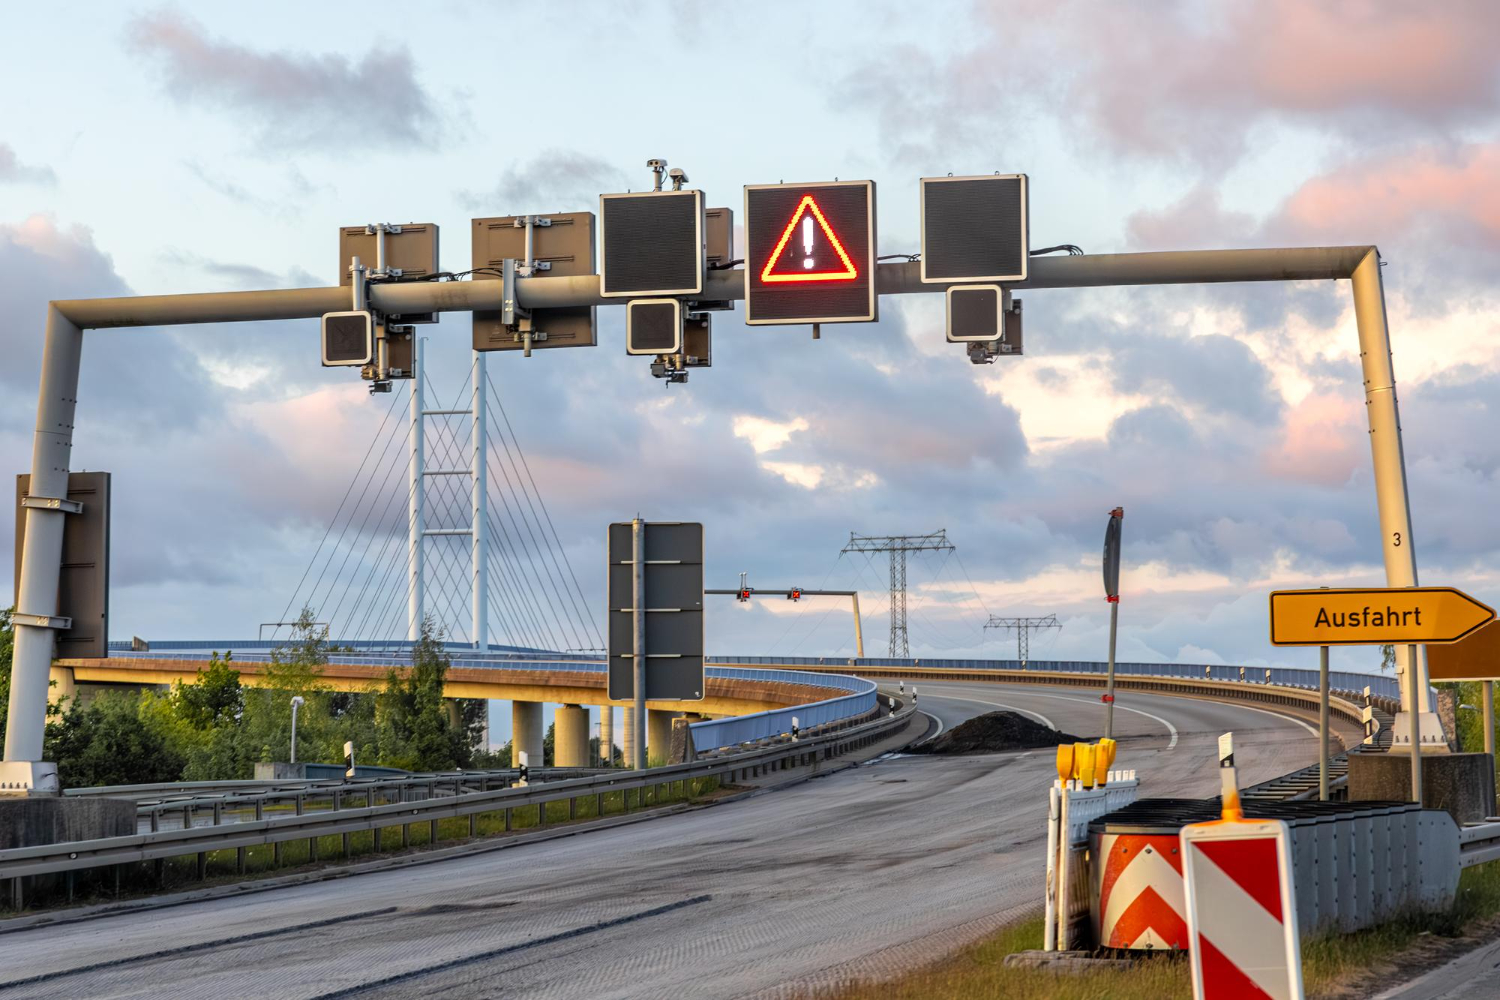
Out on interstates, design already does the heavy lifting. Expect more 80 zones where geometry, weather, and spacing justify it, often with variable limits that drop during storms.
What this means for drivers
On the highway, treat the sign as a ceiling and your sightlines as the truth. Wind, rain, heavy traffic, or dusk should pull you under posted speed even if the limit is high.
In town, expect more 20 and 25 corridors near schools, main streets, and dense housing. The extra seconds you spend translate into a lot less kinetic energy when someone makes a mistake. That is the bargain. It is worth it.
Sources
- IIHS. Maximum posted speed limits by state; includes 80 and 85 mph segments.
- NHTSA. Traffic Safety Facts 2023: 11,775 speeding-related deaths; 29 percent of total.
- FHWA. MUTCD 11th edition and Federal Register note: 85th percentile not sole basis; consider context and countermeasures.
- DC DOT. Default 20 mph on local streets, effective June 1, 2020.
- Portland PBOT and PSU studies on 20 mph; reductions in high-end speeding.
- IIHS and peer-reviewed studies on Boston and Seattle speed-limit reductions and injury risk.